EMA 20
₹13.08
EMA 50
₹14.57
EMA 200
₹15.29
RSI (14)
19.10
VWAP
₹18.77
Support (20d)
₹11.59
Resistance (20d)
₹14.34
Pivot Point
₹12.23
R1
₹12.36
S1
₹12.07
Gap Status
Gap Down
Volume Spike
Yes
Technical Commentary
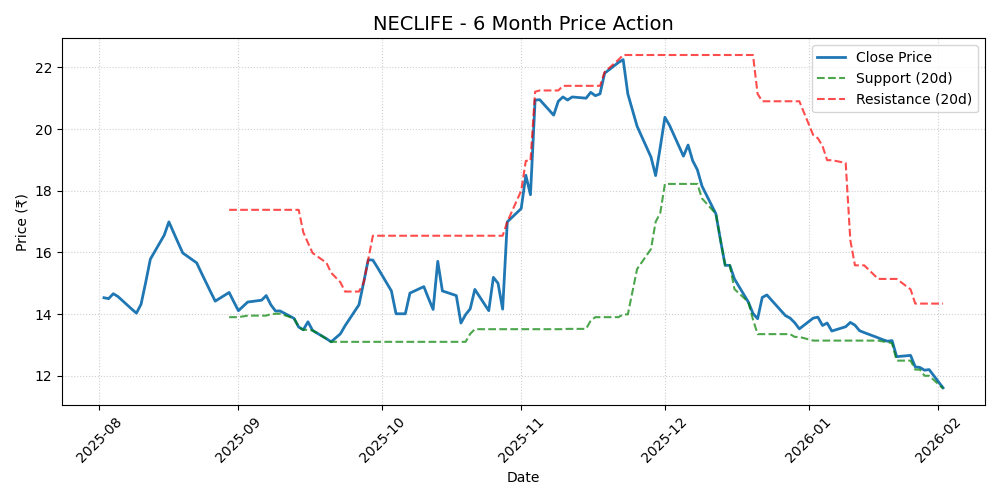
6-Month Price Action Chart
 ← Back to Dashboard
The comprehensive technical analysis for NECTAR LIFESCIENCES LTD. (NECLIFE) reveals a distinctly bearish trend based on the latest market data. At present, the underlying asset is trading near ₹11.61, positioning itself critically below the foundational 20-day Exponential Moving Average (EMA) of ₹13.08. When we zoom out to evaluate the broader structural context, we find the 50-day EMA situated at ₹14.57 and the long-term 200-day EMA providing a macro gauge at ₹15.29. From a momentum perspective, NECLIFE is currently exhibiting weak momentum. The 14-period Relative Strength Index (RSI) is hovering precisely around 19.10, placing the asset firmly in trading in oversold territory, which could present a potential reversal opportunity. In terms of identifying actionable key price levels, a solid floor of immediate support has been established near the 20-day low of ₹11.59. Conversely, formidable overhead resistance looms at the 20-day peak of around ₹14.34. Traders must note the recent gap down action, which emphasizes abrupt selling pressure and potential continued downside risk. Furthermore, this recent price action is accompanied by a massive volume spike, adding considerable credibility and weight to the current directional bias. For swing traders operating on multi-day timeframes, the fundamental relationship between the current spot price and these aforementioned EMA trajectories offers an excellent framework for strategic entries and strict risk management. Simultaneously, intraday traders should monitor these specified support and resistance zones extremely closely for high-probability breakout or breakdown setups. Overall, the overarching technical posture remains decisively bearish, demanding vigilant observation of crucial pivot levels throughout the upcoming trading sessions.