EMA 20
₹61.87
EMA 50
₹62.07
EMA 200
₹70.34
RSI (14)
51.75
VWAP
₹65.75
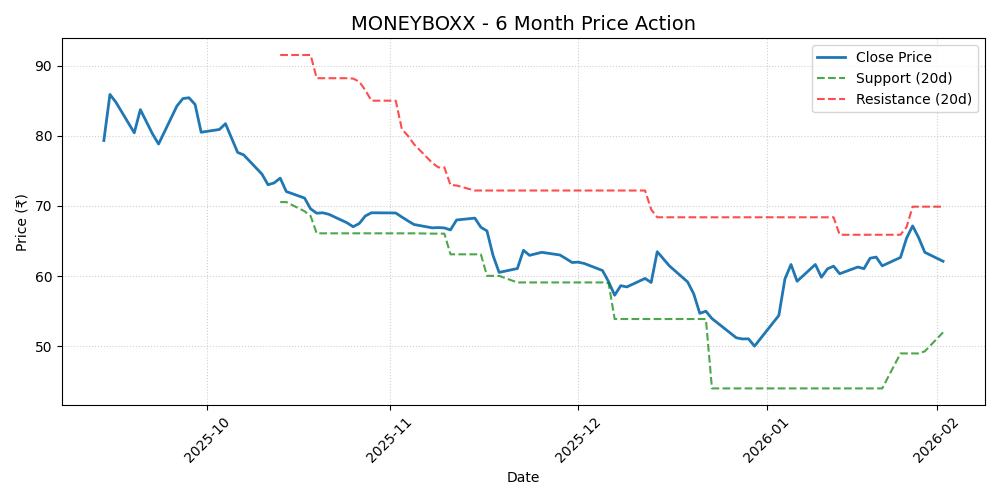
Support (20d)
₹52.00
Resistance (20d)
₹69.90
Pivot Point
₹63.52
R1
₹64.55
S1
₹62.38
Gap Status
Gap Up
Volume Spike
No
Technical Commentary
6-Month Price Action Chart
 ← Back to Dashboard
The comprehensive technical analysis for MONEYBOXX FINANCE LIMITED (MONEYBOXX) reveals a distinctly bullish trend based on the latest market data. At present, the underlying asset is trading near ₹62.13, positioning itself critically above the foundational 20-day Exponential Moving Average (EMA) of ₹61.87. When we zoom out to evaluate the broader structural context, we find the 50-day EMA situated at ₹62.07 and the long-term 200-day EMA providing a macro gauge at ₹70.34. From a momentum perspective, MONEYBOXX is currently showing neutral momentum. The 14-period Relative Strength Index (RSI) is hovering precisely around 51.75, placing the asset firmly in maintaining healthy mid-range levels without immediate extremes. In terms of identifying actionable key price levels, a solid floor of immediate support has been established near the 20-day low of ₹52.00. Conversely, formidable overhead resistance looms at the 20-day peak of around ₹69.90. Notably, the stock recently experienced a significant gap up in price, aggressively indicating strong buying interest and underlying bullish sentiment. Current trading volume remains relatively average, meaning recent moves lack the explosive participation of institutional buyers. For swing traders operating on multi-day timeframes, the fundamental relationship between the current spot price and these aforementioned EMA trajectories offers an excellent framework for strategic entries and strict risk management. Simultaneously, intraday traders should monitor these specified support and resistance zones extremely closely for high-probability breakout or breakdown setups. Overall, the overarching technical posture remains decisively bullish, demanding vigilant observation of crucial pivot levels throughout the upcoming trading sessions.